The Data View is a set of tabs on the right side of the Graph, providing fast access to project structure, build outputs, node diagnostics, and exposed variables.
Use it when you need to find a node, audit a graph before building, inspect known values, or expose parameters for automation and macro workflows.
Terrain Tab
The Terrain tab contains the node tree and graph filters. It is useful for navigating large graphs, finding maintenance targets, and checking what a project contains without panning around the Graph view.
Locked and Underlay Nodes
The green and pink icons at the top represent the current Locked Preview and Underlay nodes. Hover over an icon to see which node is assigned, or click it to navigate to that node.
Locked Preview keeps the viewport focused on a chosen downstream node while you edit upstream work. Underlay controls which terrain is shown beneath masks and color data. For more detail, see Lock Preview and Underlays.
Graph Hierarchy
The node tree shows the graph hierarchy: graph tabs, groups, nodes, and notes. Tabs can also represent separate graph .tfrag content when those are used in the project.
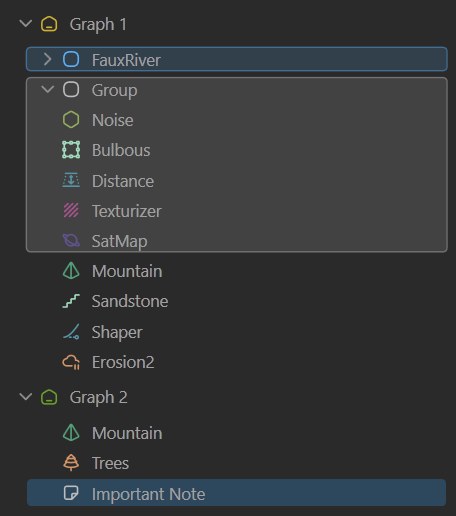
Groups and tabs can be expanded or collapsed to keep large graphs readable. Nodes inside those containers are shown in the order they appear on the graph, from left to right. Notes are also listed so important annotations remain visible from the same navigation surface.
Most node-based keyboard shortcuts also work from the Data View. You can use the default shortcuts, or customize them from Options > Graph.
Filtering Nodes
The filter dropdown lets you isolate nodes by type or behavior. When a filter is active, other nodes are hidden from the tree and visually muted in the graph.
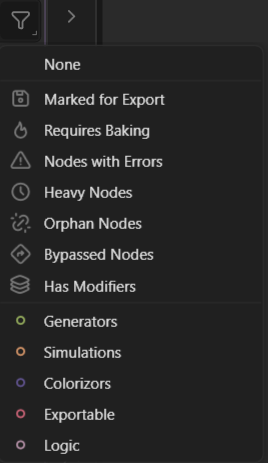
None: Clears the filter and shows the full hierarchy again.
Marked for Export: Shows nodes that will export data.
Requires Baking: Shows nodes that need to be baked before a Hybrid or Tiled build.
Nodes with Errors: Shows nodes that may be faulting or failing validation. This is useful for tracking down graphs that will not build or fail during a build.
Heavy Nodes: Shows nodes that take the most time to build in your graph, based on a median calculation.
Orphan Nodes: Shows nodes that are not connected or do not contribute to any final output. Removing orphans can save resources and reduce clutter.
Bypassed Nodes: Shows nodes that are currently bypassed, so you can quickly find temporary tests or disabled branches.
Has Modifiers: Shows nodes with modifiers attached.
By Type: Shows only nodes from a specific category, such as Generators, Simulations, Colorizors, Exportable, or Logic.
Build Tab
The Build tab shows the build controls most commonly needed while working in the graph. It lists nodes marked for export and lets you review output settings before leaving the Data View.
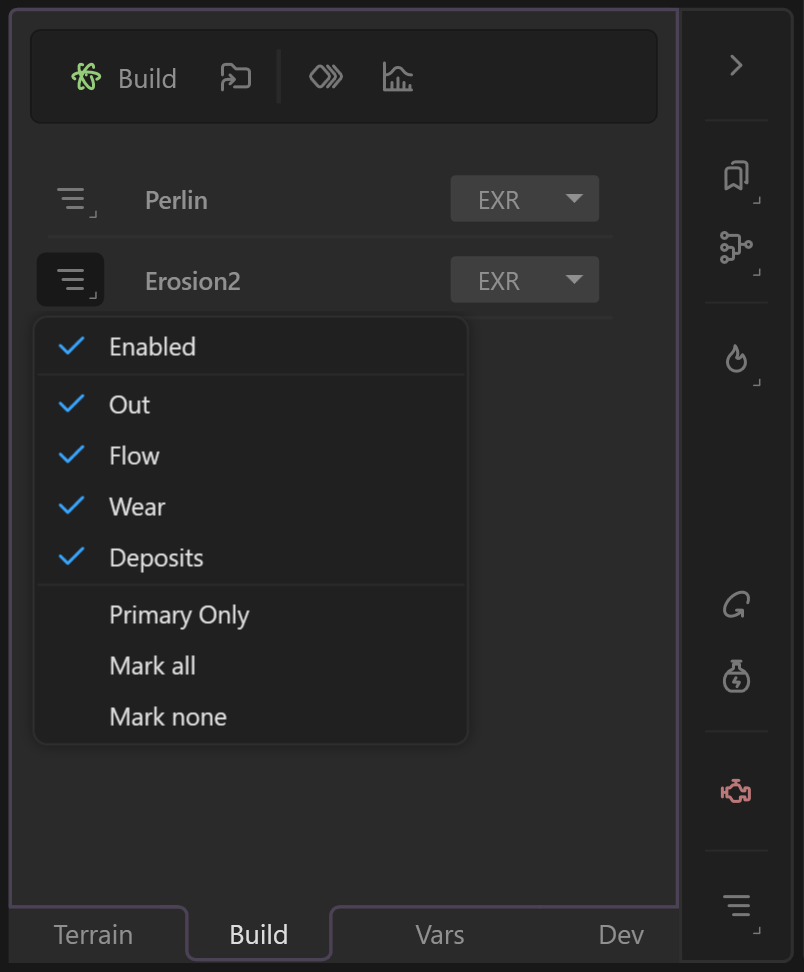
Use the Build tab to check:
- the current build resolution
- the build destination and output filename pattern
- which nodes are marked for export
- which ports will be written
- the output format for each export
The toolbar includes shortcuts for moving to build configuration, output files, and output configuration. Use More settings or the related toolbar commands when you need the full Build Options window.
For detailed export-node controls, see Nodes.
Stats Tab
The Stats tab shows detailed information about the selected node and its generated data. It is a useful companion for diagnostics, debugging, and optimization because it exposes values that are otherwise easy to guess at incorrectly.
Depending on the selected node and its output, the Stats tab can show:
- node ID and name
- build state and last build time
- output resolution, channel count, and data type
- estimated output size
- min, max, and range values for heightfields and masks
- per-channel output information for multi-output or color nodes
- node errors and build messages
Use this tab when you need known values for a downstream workflow, when a node is producing unexpected data, or when you are looking for opportunities to optimize a graph. For a wider pre-build audit workflow, see Audit a Graph Before Build with Data View.
Variables Tab
The Vars tab is where you create, organize, and control exposed parameters. Variables are useful when a value needs to be reused, exposed to a build pipeline, driven from the command line, or packaged into a macro or bridge workflow.
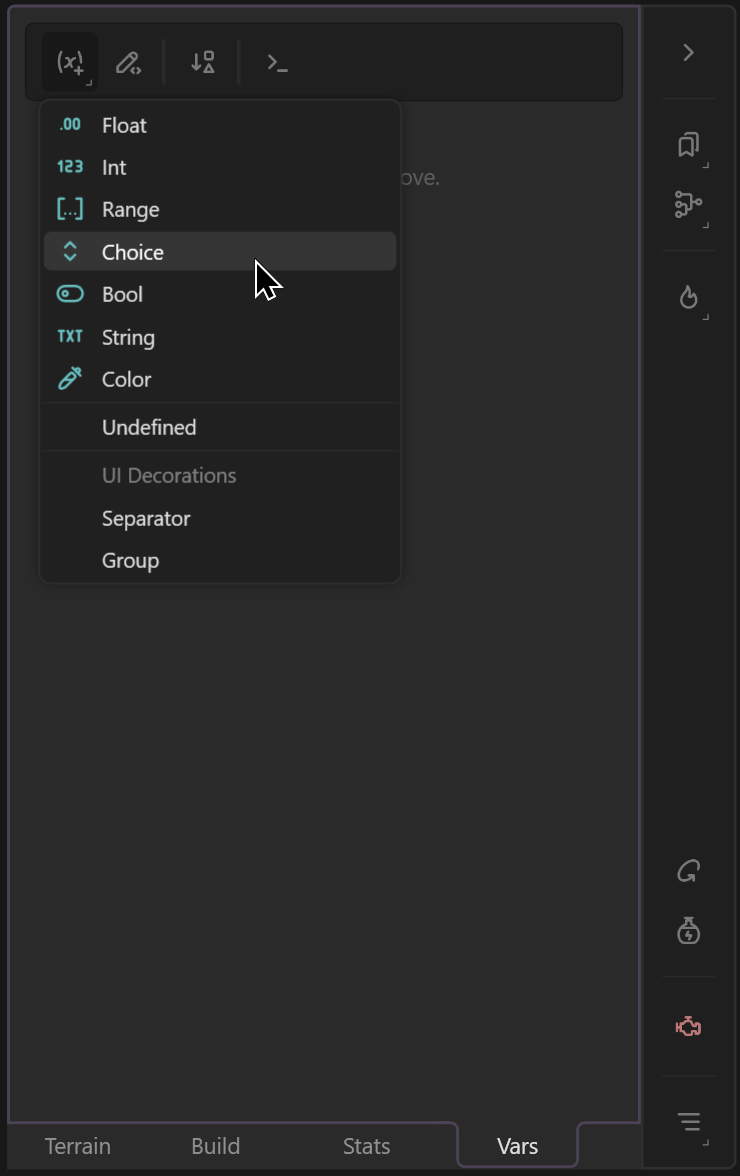
Variables can be created as Float, Int, Range, Choice, Bool, String, or Color values. Advanced workflows can also use Undefined variables, and UI decorations such as separators and groups help organize exposed controls.
The tab includes tools for editing variables, grouping them by node, binding and unbinding properties, and preparing values for automation. The command-line shortcut helps copy variable configuration strings for CLI builds.
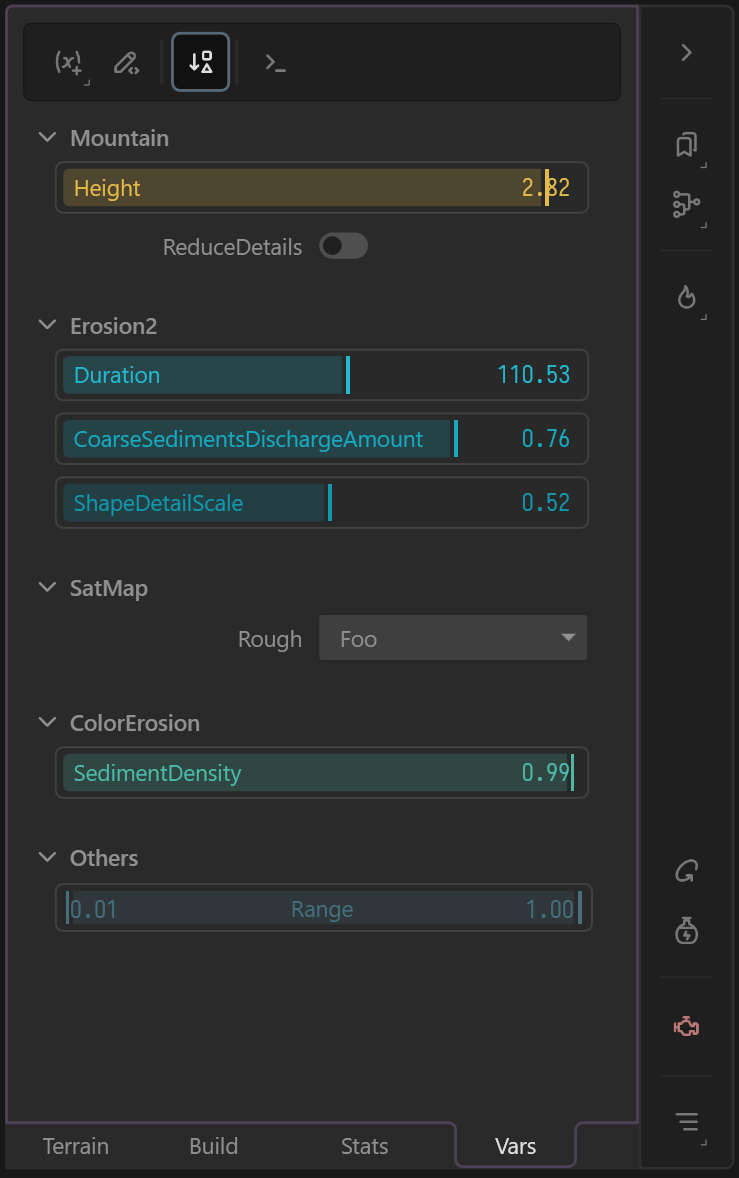
For plugin and macro workflows, the port shortcuts can create exposed controls for all ports, input-only ports, or output-only ports. This is useful for advanced workflows such as Houdini bridge setups and reusable macros where node inputs and outputs need to be exposed deliberately.
For a full variable workflow, see Variables.
 using AngryMonkey